The mean of five observations is $15$. If the mean of first three observations is $14$ and that of the last three observations is $17$, then the third observation is
The mean of seven observations is $17$. If the mean of the first four observations is $15$ and that of the last four observations is $18$, then the fourth observation is :
Following data shows the marks obtained by $100$ students in a class test : Marks obtained: $20, 29, 28, 33, 42, 38, 43, 25$. Number of students: $6, 28, 24, 15, 2, 4, 1, 20$. The median will be the average of which two observations ?
The median of a set of $15$ distinct observations is $30.5$. If each of the largest $7$ observations of the set is increased by $3$, then the median of the new set.
Assertion (A) : Median marks of students in a class test is $16$. It means half of the class got marks less than $16$. Reason (R) : Median divides the distribution in two equal parts.
(a)Both Assertion (A) and Reason (R) are true and Reason (R) is the correct explanation of Assertion (A).
(b)Both Assertion (A) and Reason (R) are true, but Reason (R) is not the correct explanation of Assertion (A).
(c)Assertion (A) is true, but Reason (R) is false.
(d)Assertion (A) is false, but Reason (R) is true.
Show SolutionHide Solution↓
(a) Both Assertion (A) and Reason (R) are true and Reason (R) is the correct explanation of Assertion (A).
Assertion (A): Median of a data is the value of $\frac{N}{2}$, where $N$ represents sum of all frequencies. Reason (R): Median divides the whole distribution in two equal parts.
(a)Both, Assertion (A) and Reason (R) are true and Reason (R) is the correct explanation of the Assertion (A).
(b)Both, Assertion (A) and Reason (R) are true, but Reason (R) is not the correct explanation of the Assertion (A).
(c)Assertion (A) is true, but Reason (R) is false.
(d)Assertion (A) is false, but Reason (R) is true.
Show SolutionHide Solution↓
Answer (D) Assertion (A) is false, but Reason (R) is true.
After an examination, a teacher wants to know the marks obtained by maximum number of the students in her class. She requires to calculate ______ of marks.
The distribution below gives the marks obtained by 80 students on a test : Marks Less than 10 Less than 20 Less than 30 Less than 40 Less than 50 Less than 60 Number of Students 3 12 27 57 75 80 The modal class of this distribution is :
In the following frequency distribution : Height (in cm) : $120-125$ $125-130$ $130-135$ $135-140$ $140-145$ Number of students : $17$ $12$ $13$ $8$ $10$ the sum of the upper limit of the modal class and the lower limit of the median class is :
For some data $x_1, x_2, \dots, x_n$ with respective frequencies $f_1, f_2, \dots, f_n$, the value of $\sum_{i=1}^{n} f_i (x_i - \bar{x})$ is equal to :
For the above distribution, the modal class is : Marks : Below $10$ Below $20$ Below $30$ Below $40$ Below $50$ Number of Students : $3$ $12$ $27$ $57$ $75$
While calculating mean of a grouped frequency distribution, step deviation method was used ($\frac{x-a}{h}=u$). It was found that $\bar{x} = 64$, $h = 5$ and $a = 62.5$. The value of $u$ is
The class mark of the median class of the following data is : begin{tabular}{|l|c|c|c|c|c|c|} hline Class Interval & $10-25$ & $25-40$ & $40-55$ & $55-70$ & $70-85$ & $85-100$ hline Frequency & $2$ & $3$ & $7$ & $6$ & $6$ & $6$ hline end{tabular}
The following distribution shows the number of runs scored by some batsmen in test matches : begin{tabular}{|l|c|c|c|c|} hline Runs Scored & $3000-4000$ & $4000-5000$ & $5000-6000$ & $6000-7000$ hline Number of Batsmen & $5$ & $10$ & $9$ & $8$ hline end{tabular} The lower limit of the modal class is :
The following table shows the marks scored by 23 students of a class. Marks: 0-10, 10-20, 20-30, 30-40, 40-50 Number of Students: 5, 3, 4, 8, 3 The lower limit of the modal class is :
For the following distribution: begin{tabular}{|l|c|c|c|c|c|} hline Class & $0-10$ & $10-20$ & $20-30$ & $30-40$ & $40-50$ hline Frequency & $10$ & $12$ & $15$ & $20$ & $9$ hline end{tabular} The sum of lower limits of the median class and modal class is
Let 'a' be the assumed mean and 'h' be the class size for a grouped data. Which of the following is not the correct formula to find the mean of the grouped data ?
(a)$\bar{x} = \frac{\Sigma f_i x_i}{\Sigma f_i}$
(b)$\bar{x} = a + \frac{\Sigma f_i d_i}{\Sigma f_i}$, where $d_i = x_i - a$
(c)$\bar{x} = a + \frac{\Sigma f_i u_i}{\Sigma f_i}$, where $u_i = \frac{x_i - a}{h}$
(d)$\bar{x} = a + \frac{\Sigma f_i y_i}{\Sigma f_i} \times h$, where $y_i = \frac{x_i - a}{h}$
Show SolutionHide Solution↓
(C) $\bar{x} = a + \frac{\Sigma f_i u_i}{\Sigma f_i}$, where $u_i = \frac{x_i - a}{h}$
While calculating mean of a grouped frequency distribution using step deviation method $u = \frac{x-a}{h}$ it was found that $\bar{x} = 62$, $a = 47.5$, $h = 5$. The value of $\bar{u}$ is:
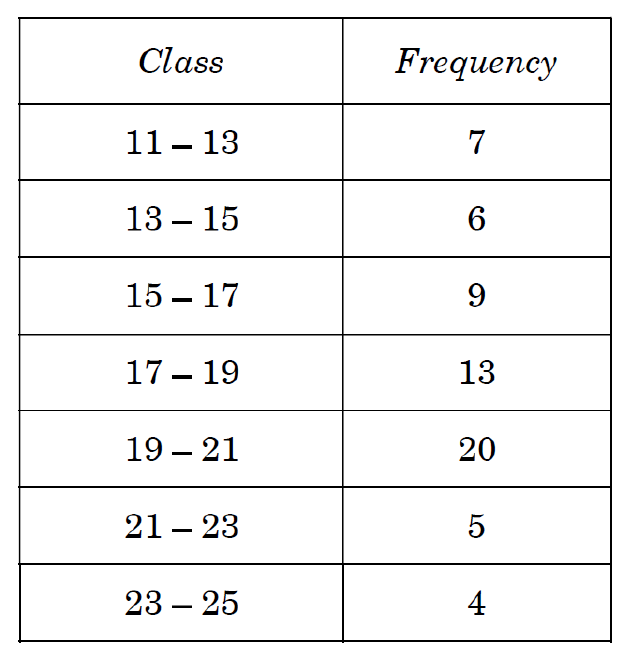
Find the mean and the median for the following frequency distribution : Class $11-13$ $13-15$ $15-17$ $17-19$ $19-21$ $21-23$ $23-25$ Frequency $7$ $6$ $9$ $13$ $20$ $5$ $4$
Show SolutionHide Solution↓
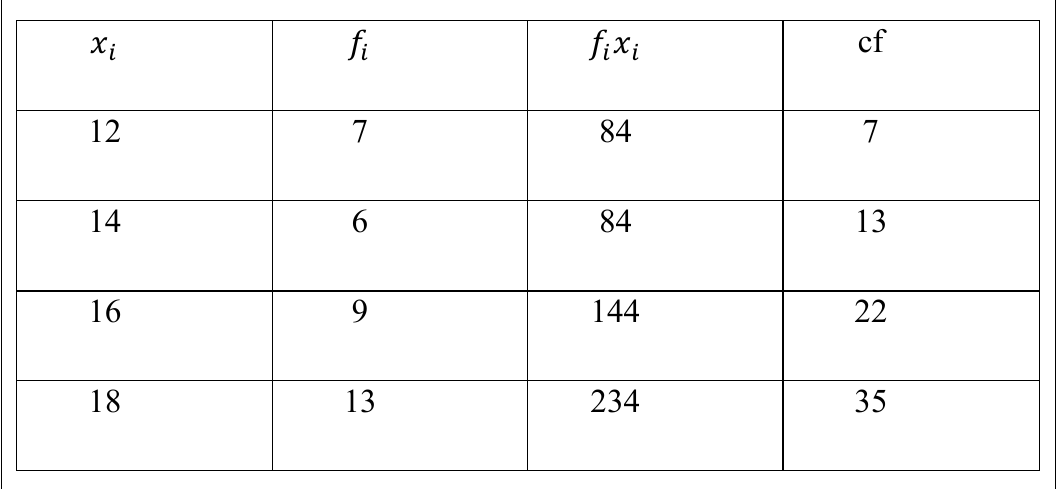
Calculation of Mean: $\sum f_i = 64$ $\sum f_i x_i = 1152$ Mean $= \frac{\sum f_i x_i}{\sum f_i} = \frac{1152}{64} = 18$. Calculation of Median: $N = 64 \Rightarrow \frac{N}{2} = 32$. The median class is $17-19$ (since cumulative frequency $22 < 32 < 35$). Lower limit of median class $l = 17$. Cumulative frequency of class preceding median class $cf = 22$. Frequency of median class $f = 13$. Class size $h = 2$. Median $= l + (\frac{\frac{N}{2} - cf}{f}) \times h$ Median $= 17 + (\frac{32 - 22}{13}) \times 2$ Median $= 17 + (\frac{10}{13}) \times 2 = 17 + \frac{20}{13}$ Median $= 17 + 1.538 \approx 18.54$.
Find the mean of the following frequency distribution : Classes quad $25-30$ quad $30-35$ quad $35-40$ quad $40-45$ quad $45-50$ quad $50-55$ quad $55-60$ Frequency quad $14$ quad $22$ quad $16$ quad $6$ quad $5$ quad $3$ quad $4$
The government rescued $100$ people after a train accident. Their ages were recorded in the following table. Find their mean age. Age (in years) Number of people rescued $10-20$ $9$ $20-30$ $14$ $30-40$ $15$ $40-50$ $21$ $50-60$ $23$ $60-70$ $12$ $70-80$ $6$
Show SolutionHide Solution↓
Age (in years) Number of people rescued ($f_i$) $x_i$ $u_i$ $f_iu_i$ $10-20$ $9$ $15$ $-3$ $-27$ $20-30$ $14$ $25$ $-2$ $-28$ $30-40$ $15$ $35$ $-1$ $-15$ $40-50$ $21$ $45$ $0$ $0$ $50-60$ $23$ $55$ $1$ $23$ $60-70$ $12$ $65$ $2$ $24$ $70-80$ $6$ $75$ $3$ $18$ Total $100$ $-5$ Mean Age $= 45 + \frac{(-5)}{100} \times 10$ $= 44.5$ Hence, mean age is $44.5$ years
The table below shows the daily expenditure on food of $25$ households in a locality : Daily expenditure (in ₹) : $200-250$ $250-300$ $300-350$ $350-400$ $400-450$ Number of households : $4$ $5$ $12$ $2$ $2$ Find the mean daily expenditure on food.
Show SolutionHide Solution↓
Correct table Mean = $325 + \frac{(-7)}{25} \times 50$ = $311$ Therefore, the mean daily expenditure on food is ₹311.
In a test, the marks obtained by $100$ students (out of $50$) are given below : Marks obtained : $0-10 \quad 10-20 \quad 20-30 \quad 30-40 \quad 40-50$ Number of students : $12 \quad 23 \quad 34 \quad 25 \quad 6$ Find the mean marks of the students.
Show SolutionHide Solution↓
Marks for correct table: $1\frac{1}{2}$ Marks Obtained: $0-10$, $f_i=12$, $x_i=5$, $f_ix_i=60$ Marks Obtained: $10-20$, $f_i=23$, $x_i=15$, $f_ix_i=345$ Marks Obtained: $20-30$, $f_i=34$, $x_i=25$, $f_ix_i=850$ Marks Obtained: $30-40$, $f_i=25$, $x_i=35$, $f_ix_i=875$ Marks Obtained: $40-50$, $f_i=6$, $x_i=45$, $f_ix_i=270$ Total: $f_i=100$, $f_ix_i=2400$ Mean $= \frac{2400}{100}$ $= 24$
India meteorological department observes seasonal and annual rainfall every year in different sub-divisions of our country. It helps them to compare and analyse the results. The table given below shows sub-division wise seasonal (monsoon) rainfall (mm) in 2018: Rainfall (mm) Number of Sub-divisions 200-400 2 400-600 4 600-800 7 800-1000 4 1000-1200 2 1200-1400 3 1400-1600 1 1600-1800 1 Based on the above information, answer the following questions: (I) Write the modal class. (II) Find the median of the given data.
Show SolutionHide Solution↓
(i) Modal Class is 600-800 (ii) $\frac{N}{2} = 12$, median class is 600 – 800 Rainfall $x_i$ $f_i$ cf. 200-400 300 2 2 400-600 500 4 6 600-800 700 7 13 800-1000 900 4 17 1000 - 1200 1100 2 19 1200-1400 1300 3 22 1400-1600 1500 1 23 1600-1800 1700 1 24 24 Median = $600 + \frac{200}{7} (12-6)$ or $771-4$ OR (ii) Rainfall $X_i$ $f_i$ $f_i x_i$ 200-400 300 2 600 400-600 500 4 2000 600-800 700 7 4900 800-1000 900 4 3600 1000 - 1200 1100 2 2200 1200-1400 1300 3 3900 1400-1600 1500 1 1500 1600-1800 1700 1 1700 24 20400 Mean = $\frac{20400}{24} = 850$ (iii) Sub-divisions having good rainfall = $2 + 3 + 1 + 1 = 7$.
Case Study – 3 A survey was conducted by the Education Ministry of India to record the teacher-student ratio in various higher secondary schools of India. The following distribution was given by the Ministry : Number of students/teacher : $15-20$ $20-25$ $25-30$ $30-35$ $35-40$ $40-45$ Number of Schools : $3$ $8$ $9$ $10$ $3$ $2$ Based on the above information, answer the following questions : (i) Write the modal class. (ii) Write the median class. (iii) (a) Find the mode of the data. OR (b) Find the median of the data.
Show SolutionHide Solution↓
(i) Modal class is $30 - 35$. (ii) Median class is $25 - 30$. (iii) (a) Mode = $30 + \frac{(10-9)}{(2 \times 10-9-3)} \times 5$ = $30.625$ OR (b) Median = $25 + \frac{(\frac{35}{2}-11)}{9} \times 5$ = $28.61$ approx.
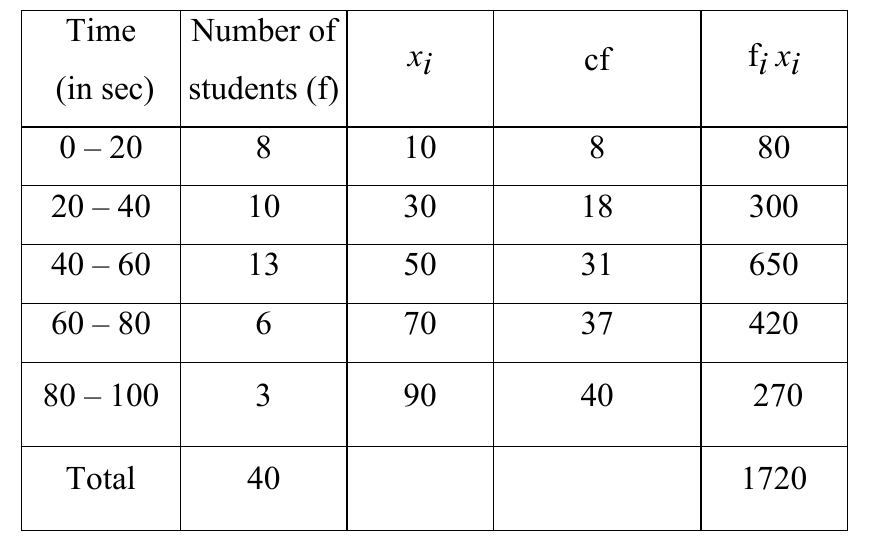
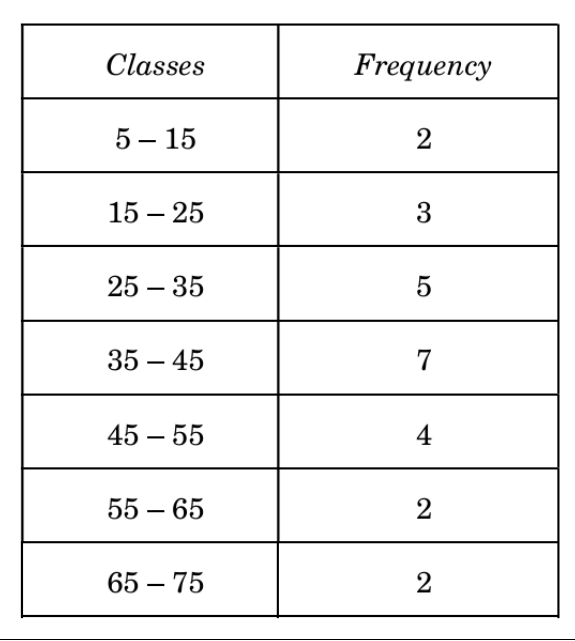
Activities like running or cycling reduce stress and the risk of mental disorders like depression. Running helps build endurance. Children develop stronger bones and muscles and are less prone to gain weight. The physical education teacher of a school has decided to conduct an inter school running tournament in his school premises. The time taken by a group of students to run $100 \text{ m}$, was noted as follows : Based on the above, answer the following questions : (i) What is the median class of the above given data ? (ii) (a) Find the mean time taken by the students to finish the race. OR (b) Find the mode of the above given data. (iii) How many students took time less than $60$ seconds ?
Show SolutionHide Solution↓
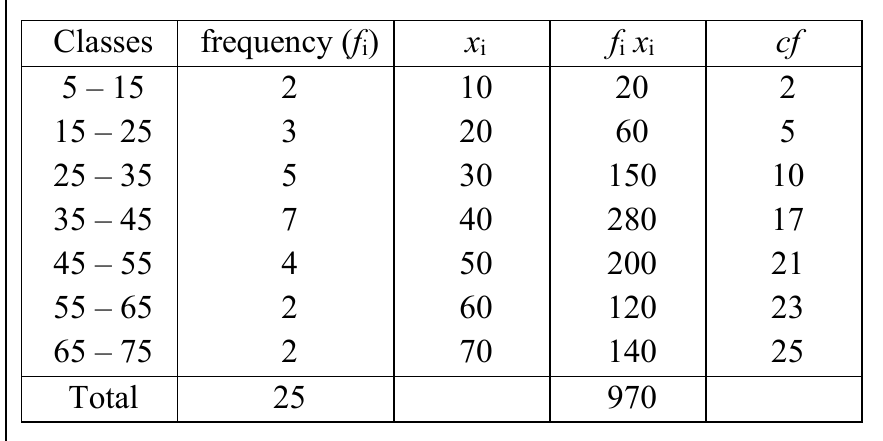
Time (in seconds) | Number of students $0-20$ | $8$ $20-40$ | $10$ $40-60$ | $13$ $60-80$ | $6$ $80-100$ | $3$ Total | $40$ (i) Correct Cummulative Frequency Median class = $40-60$ (ii) (a) Correct table for $x_i$ and $f_ix_i$ Time (in sec) | Number of students (f) | $x_i$ | cf | $f_ix_i$ $0-20$ | $8$ | $10$ | $8$ | $80$ $20-40$ | $10$ | $30$ | $18$ | $300$ $40-60$ | $13$ | $50$ | $31$ | $650$ $60-80$ | $6$ | $70$ | $37$ | $420$ $80-100$ | $3$ | $90$ | $40$ | $270$ Total | $40$ | | | $1720$ Mean = $$\begin{aligned}& \frac{1720}{40} = 43\ \text{OR} \\ & (b) \text{ Modal class } = 40-60 \\ & \text{Mode } = 40 + \frac{(13-10)}{(26-10-6)} \times 20 \\ & = 46 \\ & (iii)\end{aligned}$$31 students took time less than 60 seconds
Case Study – 1 Student-teacher ratio expresses the relationship between the number of students enrolled in a school and the number of teachers employed by the school. This ratio is important for a number of reasons. It can be used as a tool to measure teachers' workload as well as the allocation of resources. A survey was conducted in $100$ secondary schools of a state and the following frequency distribution table was prepared : Number of students per Teacher: $20-25$, $25-30$, $30-35$, $35-40$, $40-45$, $45-50$ Number of Schools: $5$, $15$, $25$, $30$, $15$, $10$ Based on the above, answer the following questions : (i) What is the lower limit of the median class? (ii) What is the upper limit of the modal class ? (iii) (a) Find the median of the data. OR (b) Find the modal of the data.
Show SolutionHide Solution↓
No. of Students per teacher | No. of School | c.f. $20-25$ | $5$ | $5$ $25-30$ | $15$ | $20$ $30-35$ | $25$ | $45$ $35-40$ | $30$ | $75$ $40-45$ | $15$ | $90$ $45-50$ | $10$ | $100$ (i) Median class is $35 - 40$ Lower limit of median class = $35$ (ii) Modal class is $35 - 40$ Upper limit of modal class = $40$ (iii) (a) Median class is $35 - 40$ Median = $$\begin{aligned}& 35 + \frac{(\frac{100}{2} - 45)}{30} \times 5 \\ & = \frac{215}{6}\end{aligned}$$ or $35.83$ approx. OR (iii) (b) Modal class is $35 - 40$ Mode = $$\begin{aligned}& 35 + \frac{30-25}{2\times30-25-15} \times 5 \\ & = 36.25\end{aligned}$$
The India Meteorological Department observes seasonal and annual rainfall every year in different sub-divisions of our country. It helps them to compare and analyse the results. The table below shows sub-divisions wise seasonal (monsoon) rainfall (in mm) in 2023.
Rainfall (mm)
No. of Sub-divisions
200-400
3
400-600
4
600-800
7
800-1000
4
1000-1200
3
1200-1400
3
Based on the information given above, answer the following questions: (i) Write the modal class. (ii) (a) Find the median of the given data. OR (b) Find the mean rainfall in the season. (iii) If a sub-division having at least $800 \operatorname{mm}$ rainfall during monsoon season is considered a good rainfall sub-division, then how many sub-divisions had good rainfall?
CENTRAL POLLUTION CONTROL BOARD'S AIR QUALITY STANDARDS AIR QUALITY INDEX (AQI) CATEGORY 0-50 Good 51-100 Satisfactory 101-200 Moderate 201-300 Poor 301-400 Very Poor 401-500 Severe The Air Quality Index (AQI) is a scale from $0$ to $500$ that indicates air quality, with higher numbers signifying more pollution and greater health concerns. Mansi collected the daily data of AQI of her city for a month and presented it as given below: AQI Range : 1-100 101-200 201-300 301-400 401-500 Number of Days: $3$ $9$ $12$ $4$ $2$ (i) Convert the data to continuous frequency distribution. (ii) What is the quality of air in most of the days of the month ? (iii) (a) Using table formed in part (i), find mode of the data. OR (b) Using table formed in part (i), find median of the data.
Show SolutionHide Solution↓
(i) Class Interval frequency 0.5-100.5 3 100.5 - 200.5 9 200.5 - 300.5 12 300.5-400.5 4 400.5-500.5 2 (1) (ii) Air Quality is poor on most of the days (1) (iii) (a) Modal class is $200.5 - 300.5$ (½) Mode = $200.5 + 100 (\frac{12-9}{2\times 12-9-4})$ (1) $= 227.77$ (½) OR (b) Class Interval frequency cf 0.5-100.5 3 3 100.5 - 200.5 9 12 200.5 - 300.5 12 24 300.5-400.5 4 28 400.5-500.5 2 30 For correct table (½) Median class is $200.5 - 300.5$ (½) Median = $200.5 + (\frac{15-12}{12}) \times 100$ (1) $= 225.5$ (½)
CENTRAL POLLUTION CONTROL BOARD'S AIR QUALITY STANDARDS AIR QUALITY INDEX (AQI) CATEGORY 0-50 Good 51-100 Satisfactory 101-200 Moderate 201-300 Poor 301-400 Very Poor 401-500 Severe The Air Quality Index (AQI) is a scale from $0$ to $500$ that indicates air quality, with higher numbers signifying more pollution and greater health concerns. Mansi collected the daily data of AQI of her city for a month and presented it as given below : AQI Range: $1-100$ $101-200$ $201-300$ $301-400$ $401-500$ Number of Days: $3$ $9$ $12$ $4$ $2$ (i) Convert the data to continuous frequency distribution. (ii) What is the quality of air in most of the days of the month? (iii) (a) Using table formed in part (i), find mode of the data. OR (b) Using table formed in part (i), find median of the data.
Show SolutionHide Solution↓
(i) Class Interval frequency $0.5-100.5$ $3$ $100.5-200.5$ $9$ $200.5-300.5$ $12$ $300.5-400.5$ $4$ $400.5-500.5$ $2$ (1 Mark) (ii) Air Quality is poor on most of the days (1 Mark) (iii) (a) Modal class is $200.5 - 300.5$ (1/2 Mark) Mode = $200.5 + 100 (\frac{12-9}{2\times12-9-4})$ (1 Mark) = $227.77$ (1/2 Mark) OR (b) Class Interval frequency cf $0.5-100.5$ $3$ $3$ $100.5-200.5$ $9$ $12$ $200.5-300.5$ $12$ $24$ $300.5-400.5$ $4$ $28$ $400.5-500.5$ $2$ $30$ For correct table (1/2 Mark) Median class is $200.5 - 300.5$ (1/2 Mark) Median = $200.5 + (\frac{15-12}{12}) \times 100$ (1 Mark) = $225.5$ (1/2 Mark)
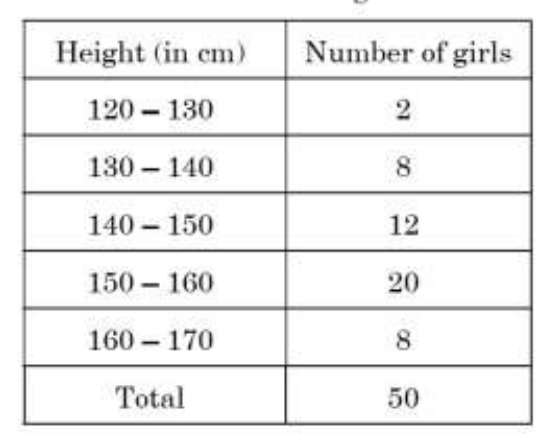
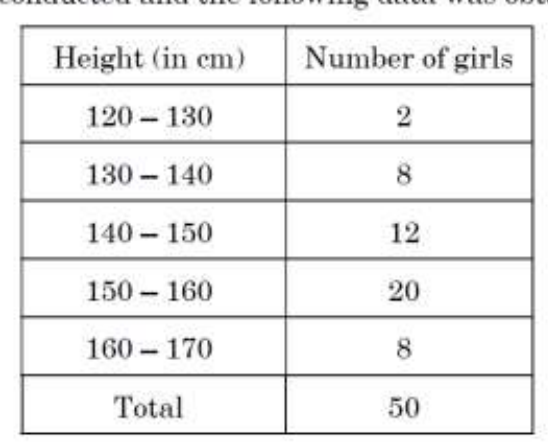
A survey regarding the heights (in cm) of $50$ girls of class X of a school was conducted and the following data was obtained : Find the mean and mode of the above data.
Show SolutionHide Solution↓
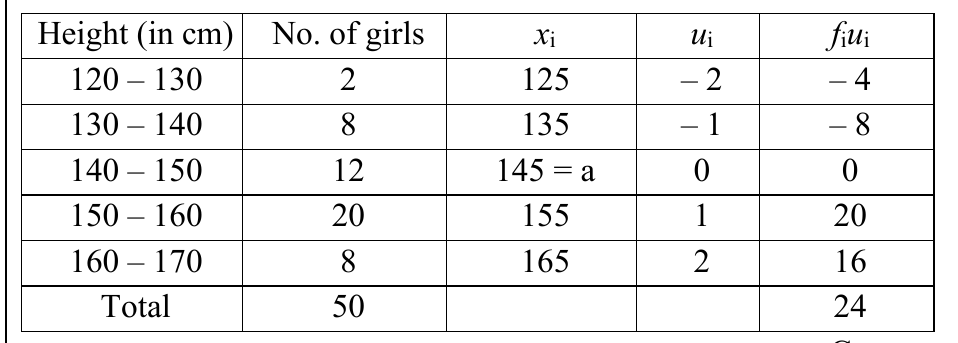
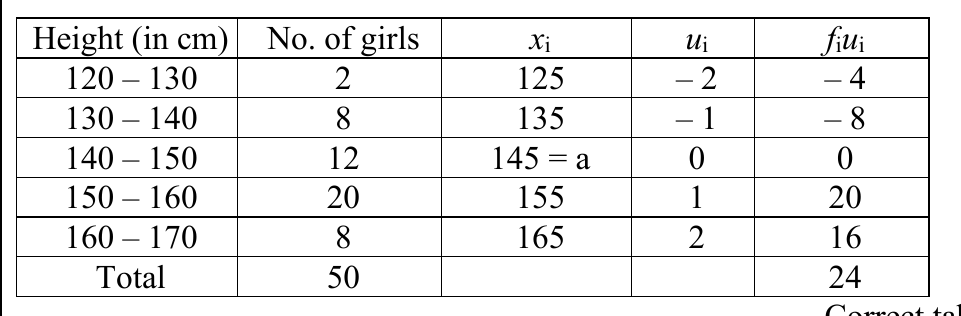
Correct table Mean $= 145 + \frac{24}{50} \times 10$ $= 149.8$ $\therefore$ mean height is $149.8$ cm Modal class is $150 - 160$ Mode $= 150 + \frac{(20-12)}{(2\times20-12-8)} \times 10$ $= 154$ $\therefore$ modal height is $154$ cm
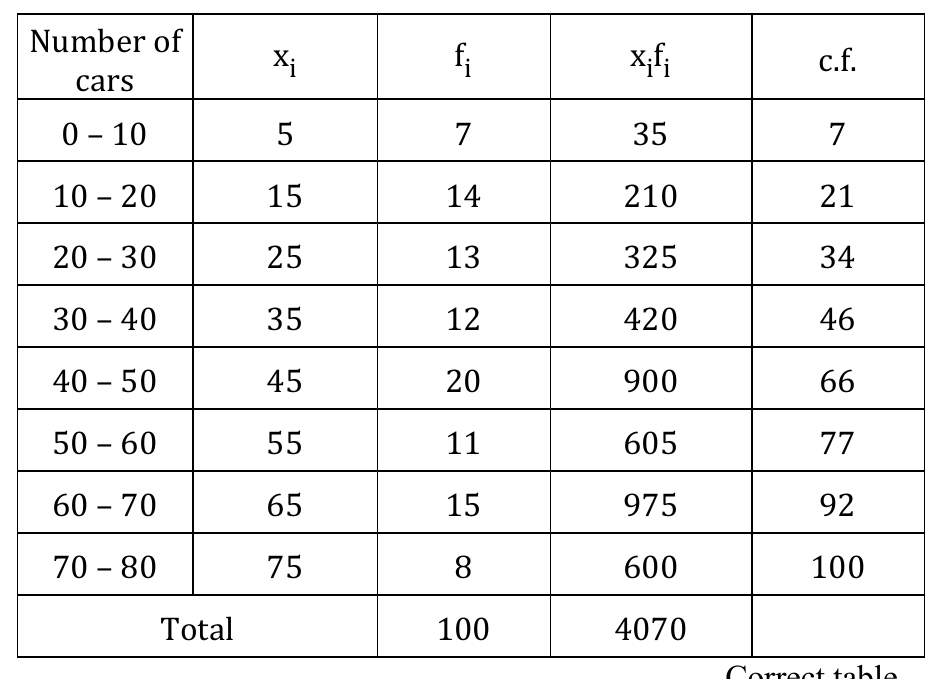
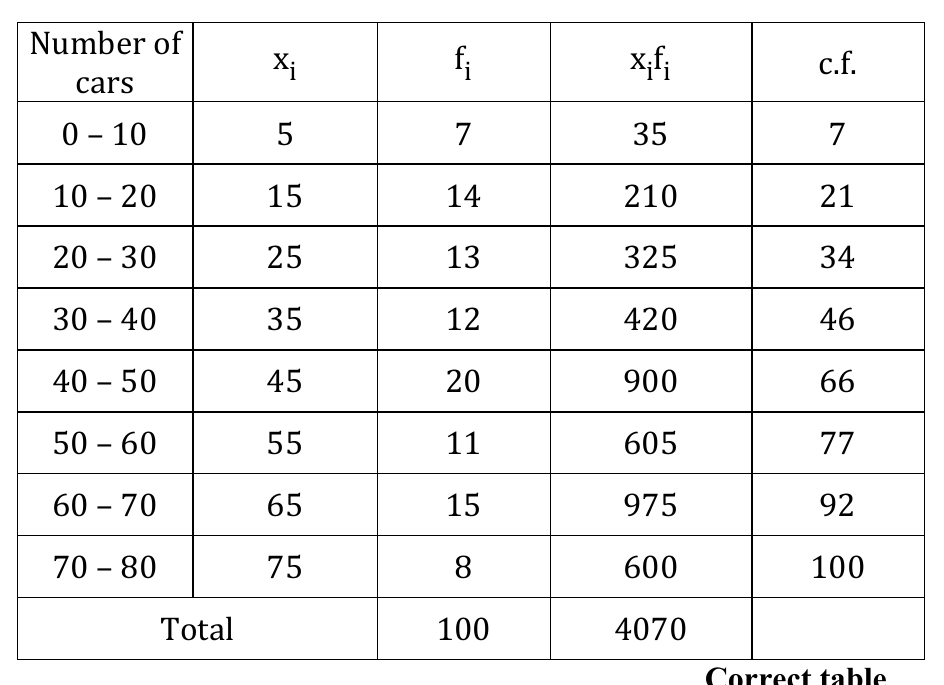
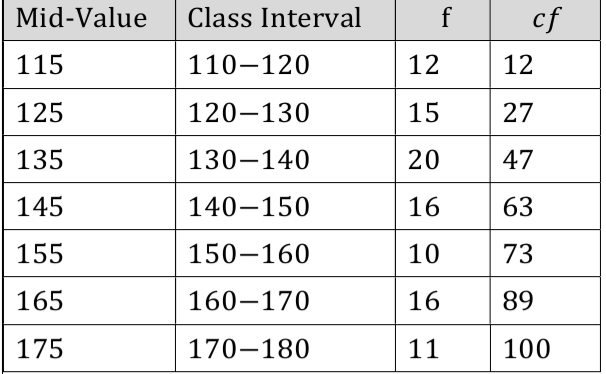
A student noted the number of cars passing through a spot on a road for $100$ periods each of $3$ minutes and summarised it in the table given below. Find the mean and median of the following data. Number of cars Frequency (periods) 0-10 7 10-20 14 20-30 13 30-40 12 40-50 20 50-60 11 60-70 15 70-80 8
A student noted the number of cars passing through a spot on a road for $100$ periods each of $3 \text{ minutes}$ and summarised it in the table given below. Find the mean and median of the following data.
The following table shows the ages of the patients admitted in a hospital during a year : Age (in years) $5-15$ $15-25$ $25-35$ $35-45$ $45-55$ $55-65$ Number of patients $6$ $11$ $21$ $23$ $14$ $5$ Find the mode and mean of the data given above.
Show SolutionHide Solution↓
Correct table Age (in years) No. of patients ($f_i$) Mid point ($x_i$) $x_if_i$ $5-15$ $6$ $10$ $60$ $15-25$ $11$ $20$ $220$ $25-35$ $21$ $30$ $630$ $35-45$ $23$ $40$ $920$ $45-55$ $14$ $50$ $700$ $55-65$ $5$ $60$ $300$ Total $80$ $$\begin{aligned}& 2830 \\ & \Rightarrow \text{Mean } = \frac{2830}{80} \\ & = 35.375 \\ & \text{Modal class } = (35 - 45) \\ & \Rightarrow \text{Mode } = 35 + (\frac{23-21}{2\times23-21-14}) \times h \\ & = 36.81 \\ & \text{Therefore, mode and mean of given data are } 36.81 \text{ years and } 35.375 \text{ years respectively.}\end{aligned}$$
The following table shows the ages of the patients admitted in a hospital during a year : Find the mode and mean of the data given above.
Show SolutionHide Solution↓
Correct table $\Rightarrow \text{Mean} = \frac{2830}{80}$ $= 35.375$ Modal class = $(35 - 45)$ $\Rightarrow \text{Mode} = 35 + \left(\frac{23-21}{2\times23-21-14}\right) \times h$ $= 36.81$ Therefore, mode and mean of given data are $36.81$ years and $35.375$ years respectively.
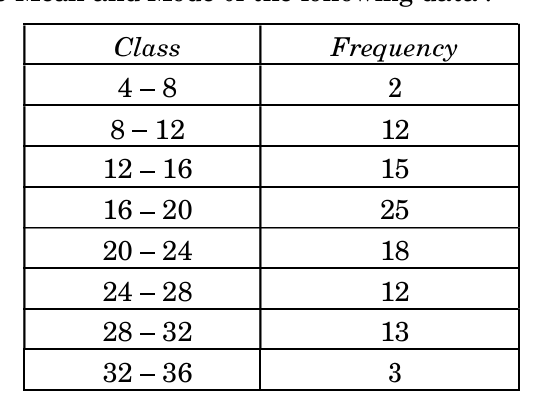
Find the Mean and Mode of the following data : Class $4-8$ $8-12$ $12-16$ $16-20$ $20-24$ $24-28$ $28-32$ $32-36$ Frequency $2$ $12$ $15$ $25$ $18$ $12$ $13$ $3$
Show SolutionHide Solution↓
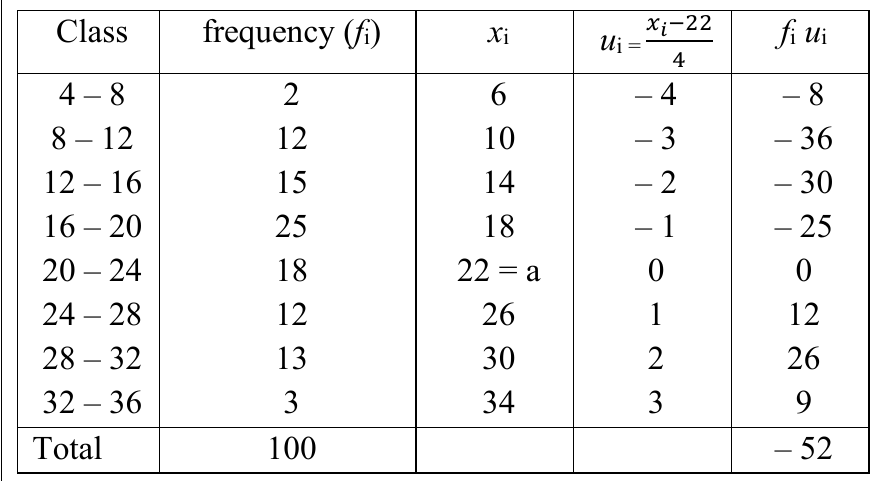
Correct table ($1\frac{1}{2}$) Mean $= 22 + \frac{(-52)}{100} \times 4$ ($1$) $= 19.92$ ($1/2$) Modal Class is $16 - 20$ ($1/2$) Mode $= 16 + \left(\frac{25-15}{2\times25-15-18}\right) \times 4$ ($1\frac{1}{2}$) $= \frac{312}{17}$ or $18.35$ approx.
The following table shows the number of patients of different age group who were discharged from the hospital in a particular month : Find the 'mean' and the 'mode' of the above data.
Show SolutionHide Solution↓
Age (in years) Number of patients ($f_i$) Class Mark ($x_i$) $f_i x_i$ $5-15$ $6$ $10$ $60$ $15-25$ $11$ $20$ $220$ $25-35$ $21$ $30$ $630$ $35-45$ $23$ $40$ $920$ $45-55$ $14$ $50$ $700$ $55-65$ $5$ $60$ $300$ Total $\Sigma f_i =80$ $\Sigma f_i x_i =2830$ $1\frac{1}{2}$ for correct table Mean = $\frac{2830}{80}$ $= \frac{283}{8}$ or $35.38$ years Modal class is $35 - 45$ Mode = $35 + \frac{23-21}{2\times23-21-14} \times 10$ $= \frac{405}{11}$ or $36.82$ years (approx.)
The following table shows the number of traffic challans issued in the month of April by the traffic police : Find the 'mean' and 'mode' of the above data.
Show SolutionHide Solution↓
Table: 0-10: 3, 5, 15 10-20: 5, 15, 75 20-30: 10, 25, 250 30-40: 9, 35, 315 40-50: 2, 45, 90 50-60: 1, 55, 55 Total: 30, 800 Mean $= \frac{800}{30} = \frac{80}{3}$ or $26.67$ or $27$ (approx.) Modal class is 20-30 Mode $= 20 + \frac{10 - 5}{2 \times 10 - 5 - 9} \times 10 = \frac{85}{3}$ or $28.3$ or $28$ (approx.)
Medical check-up was carried out for 35 students of a class and their weights were recorded as follows: Find the difference between the mean weight and the median weight.
Show SolutionHide Solution↓
Correct table Mean $= 45 + \frac{14}{35} \times 2 = 45.8$ $\therefore$ Mean weight is 45.8 kg Median Class is 46 - 48 Median $= 46 + \frac{\frac{35}{2} - 14}{14} \times 2 = 46.5$ $\therefore$ Median weight is 46.5 kg Difference of mean weight and median weight $= 46.5 - 45.8 = 0.7$ kg
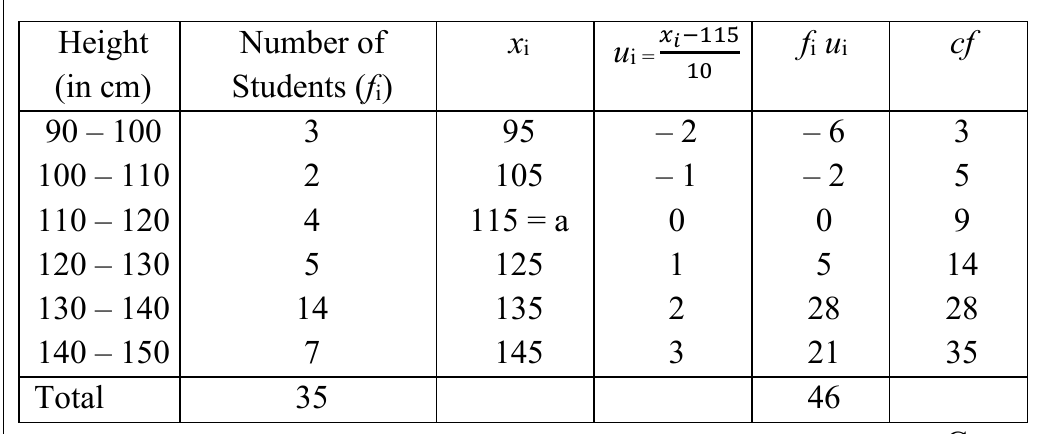
During a medical checkup, height of 35 students of a class were recorded as follows :
Height (in cm)
90-100
100-110
110-120
120-130
130-140
140-150
Number of Students
3
2
4
5
14
7
Find the difference between the mean height and median height.
Show SolutionHide Solution↓
Correct table Mean $= 115 + \frac{46}{35} \times 10 = \frac{897}{7}$ or 128.14 approx. $\therefore$ Mean height is $\frac{897}{7}$ cm or 128.14 cm approx. Median Class is 130 - 140 Median $= 130 + \frac{\frac{35}{2} - 14}{14} \times 10 = 132.5$ $\therefore$ Median height is 132.5 cm Difference of mean height and median height $= 132.5 - 128.14 = 4.36$ cm
The following table gives the daily income of $50$ cab drivers of a particular city : Income (₹): $500-600, 600-700, 700-800, 800-900, 900-1000$. No. of Drivers: $12, 14, 8, 6, 10$. Find the mean income and the modal income.
Show SolutionHide Solution↓
Correct table Mean = $750 + \frac{(-12)}{50} \times 100 = 726$ $\therefore$ Mean income is ₹ $726$ Modal Class is $600-700$ Mode = $600 + \frac{14 - 12}{(2 \times 14 - 12 - 8)} \times 100 = 625$ $\therefore$ Modal income is ₹ $625$.
Following data shows the number of family members living in different bungalows of a locality: If the median number of members is found to be $5$, find the values of $p$ and $q$.
Show SolutionHide Solution↓
Correct table. $75 + p + q = 120 \Rightarrow p + q = 45$. Median is $5 \therefore$ Median class is $4 - 6$. $5 = 4 + [\frac{120/2 - (10+p)}{60}] \times 2$. On solving, we get $p = 20$ and $q = 25$.
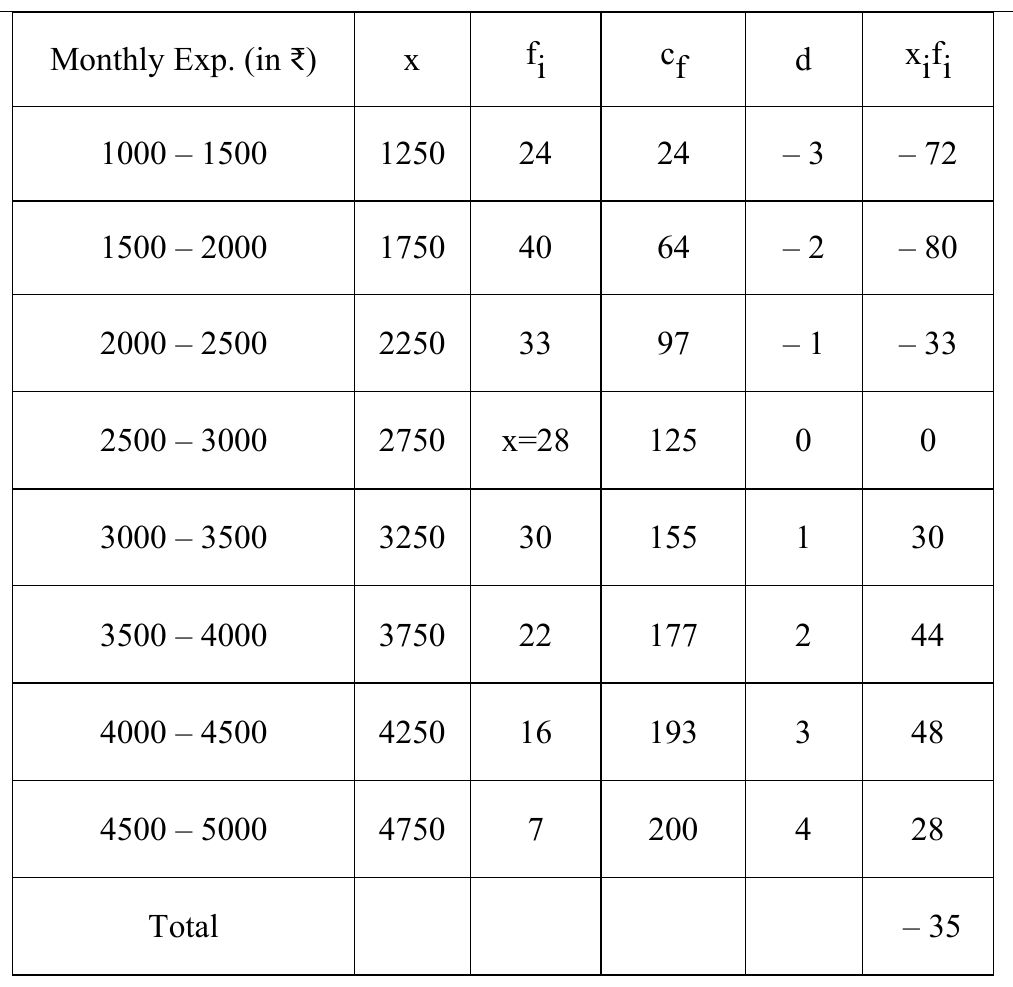
The monthly expenditure on fruits in $200$ families of a Housing Society is given below. Find the value of $x$ and also find the mode and mean expenditure on fruits.
Monthly Expenditure (in ₹)
No. of Families
1000-1500
24
1500-2000
40
2000-2500
33
2500-3000
28
3000-3500
$x$
3500-4000
22
4000-4500
16
4500-5000
7
Show SolutionHide Solution↓
Correct Table (1/2 Mark) $170 + x = 200 \implies x = 30$ (1/2 Mark) $1500-2000$ is the modal class (1/2 Mark) $\text{Mode} = 1500 + (\frac{40-24}{2\times40-24-33}) \times 500$ (1 Mark) $= 1500 + 347.82$ $= 1847.82$ (1/2 Mark) Hence the modal monthly expenditure is ₹$1847.82$ $\therefore \sum f_i x_i = 435000 + 3250 \times 30 = 532500$ (1 Mark) Mean $= \frac{532500}{200} = 2662.50$ (1 Mark) Hence the mean monthly expenditure is ₹$2662.50$
An SBI health insurance agent found the following data for distribution of ages of $100$ policy holders. The health insurance policies are given to persons of age $15$ years and onwards, but less than $60$ years. Age (in yrs) $15-20$ $20-25$ $25-30$ $30-35$ $35-40$ $40-45$ $45-50$ $50-55$ $55-60$ Number of policy holders $2$ $4$ $18$ $21$ $33$ $11$ $3$ $6$ $2$ Find the modal age and median age of the policy holders.
Show SolutionHide Solution↓
For correct table Age (in years) f cf $15-20$ $2$ $2$ $20-25$ $4$ $6$ $25-30$ $18$ $24$ $30-35$ $21$ $45$ $35-40$ $33$ $78$ $40-45$ $11$ $89$ $45-50$ $3$ $92$ $50-55$ $6$ $98$ $55-60$ $2$ $100$ Total $100$ (1 Mark) Modal class = $35-40$ (1/2 Mark) Mode $= 35 + \frac{33-21}{2(33)-21-11} \times 5$ (1 Mark) $= \frac{625}{17} = 36.7$(approx.) (1/2 Mark) $\therefore$ Modal age = $36.7$ years (approx.) $\frac{n}{2} = 50$, Median class = $35- 40$ (1/2 Mark) Median $= 35 + \frac{50-45}{33} \times 5$ (1 Mark) $= \frac{1180}{33} = 35.7$(approx.) (1/2 Mark) $\therefore$ Median age = $35.7$ years (approx.)
An SBI health insurance agent found the following data for distribution of ages of 100 policy holders. The health insurance policies are given to persons of age 15 years and onwards, but less than 60 years.
Age (in yrs)
Number of policy holders
15 - 20
2
20 - 25
4
25 - 30
18
30 - 35
21
35 - 40
33
40 - 45
11
45 - 50
3
50 - 55
6
55 - 60
2
Find the modal age and median age of the policy holders.
Show SolutionHide Solution↓
Age (in years) | f | cf 15 - 20 | 2 | 2 20 - 25 | 4 | 6 25 - 30 | 18 | 24 30 - 35 | 21 | 45 35 - 40 | 33 | 78 40 - 45 | 11 | 89 45 - 50 | 3 | 92 50 - 55 | 6 | 98 55 - 60 | 2 | 100 Total | 100 For correct table (1 Mark) Modal class = 35-40 (1/2 Mark) Mode = $35 + \frac{33-21}{2(33)-21-11} \times 5$ (1 Mark) $= \frac{625}{17} = 36.7(\text{approx.})$ (1/2 Mark) Modal age = 36.7 years (approx.) $\frac{n}{2} = 50$, Median class = 35 – 40 (1/2 Mark) Median = $35 + \frac{50-45}{33} \times 5$ (1 Mark) $= \frac{1180}{33} = 35.7(\text{approx.})$ (1/2 Mark) Median age = 35.7 years (approx.)
Find mean and mode of the following distribution : Class: $0-15$ $15-30$ $30-45$ $45-60$ $60-75$ $75-90$ $90-105$ Frequency: $4$ $8$ $11$ $14$ $10$ $7$ $6$
Find mean and mode of the following frequency distribution : Class: $5-15$ $15-25$ $25-35$ $35-45$ $45-55$ $55-65$ Frequency: $11$ $20$ $25$ $22$ $12$ $10$
Find the mean and mode of the following frequency distribution : Class Interval: $400-450$ $450-500$ $500-550$ $550-600$ $600-650$ $650-700$ Frequency: $15$ $18$ $20$ $23$ $22$ $12$
Show SolutionHide Solution↓
Correct table (I Mark) Mean = $525 + \frac{55}{110} \times 50$ (II Mark) $= 550$ (III Mark) Modal class is $550 - 600$ (IV Mark) Mode = $550 + \frac{23 - 20}{46 - 20 - 22} \times 50$ (V Mark) $= \frac{1175}{2} = 587.5$ (VI Mark)
The following frequency distribution gives the monthly consumption of electricity of 68 consumers of a locality. Find the monthly mean consumption from the data. begin{tabular}{|c|c|} hline Monthly Consumption (in units) & Number of Consumers hline 50-100 & 4 hline 100-150 & 5 hline 150-200 & 13 hline 200-250 & 20 hline 250-300 & 14 hline 300-350 & 8 hline 350-400 & 4 hline end{tabular}
A life insurance agent found the following data for the distribution of $100$ policy holders on the basis of their ages. begin{tabular}{|c|c|} hline Age (in years) & Number of policy holders hline $15-20$ & $2$ hline $20-25$ & $4$ hline $25-30$ & $18$ hline $30-35$ & $21$ hline $35-40$ & $33$ hline $40-45$ & $11$ hline $45-50$ & $3$ hline $50-55$ & $6$ hline $55-60$ & $2$ hline end{tabular} Find the median age of the policy holders.
Show SolutionHide Solution↓
begin{tabular}{|c|c|c|} hline $CI$ & $f_i$ & $Cf$ hline $15-20$ & $2$ & $2$ hline $20-25$ & $4$ & $6$ hline $25-30$ & $18$ & $24$ hline $30-35$ & $21$ & $45$ hline $35-40$ & $33$ & $78$ hline $40-45$ & $11$ & $89$ hline $45-50$ & $3$ & $92$ hline $50-55$ & $6$ & $98$ hline $55-60$ & $2$ & $100$ hline end{tabular} $\frac{N}{2} = 50 \therefore$ median class : $35-40$ Median $= 35 + \frac{50 - 45}{33} \times 5 = 35.76$ Thus, the median age of the policy holders is $35.76$ years.
The lengths of $40$ leaves of a plant are measured, correct to the nearest millimetre and data obtained is represented in the following table : begin{tabular}{|c|c|} hline Length in (mm) & Number of leaves hline 100 - 120 & 8 hline 120 - 140 & 9 hline 140 - 160 & 12 hline 160 - 180 & 5 hline 180 - 200 & 6 hline end{tabular} Find the median length (in mm) of the leaves.
A class teacher has the following absentees record of $30$ students of a class. begin{tabular}{|c|c|c|c|c|c|c|} hline Number of days & 0 - 4 & 4 - 8 & 8 - 12 & 12 - 16 & 16 - 20 & 20 - 24 hline Number of Absent students & 1 & 8 & x & 6 & 5 & y hline end{tabular} If the mean number of days a student was absent is $12$, find the values of $x$ and $y$.
The weights of 30 students of a class are given in the following distribution table : Weight (in kg): 40-45, 45-50, 50-55, 55-60, 60-65, 65-70 Number of students: 2, 5, 8, 6, 6, 3 Find the median weight of the students.
Show SolutionHide Solution↓
Correct Table with $Cf$: 2, 7, 15, 21, 27, 30 (2 marks). Median class: 50-55. Median $= l + \frac{\frac{N}{2} - cf}{f} \times h = 50 + \frac{15 - 7}{8} \times 5 = 55$. Median weight $= 55$ kg. ($2 + 1$ marks)
Find 'mean' and 'mode' of the following data : begin{tabular}{|l|c|c|c|c|c|c|} hline Class & 10-25 & 25-40 & 40-55 & 55-70 & 70-85 & 85-100 hline Number of Students & 12 & 10 & 15 & 13 & 8 & 12 hline end{tabular}
The following table shows the ages of patients admitted in a hospital during a year : begin{tabular}{|l|c|c|c|c|c|c|} hline Age (in years) & 5-15 & 15-25 & 25-35 & 35-45 & 45-55 & 55-65 hline Number of Patients & 7 & 10 & 21 & 22 & 15 & 5 hline end{tabular} Find 'mode' and 'median' of the above data.
Find the mode and the mean of the following frequency distribution : begin{tabular}{|l|c|c|c|c|c|} hline Class & $0-8$ & $8-16$ & $16-24$ & $24-32$ & $32-40$ hline Frequency & $6$ & $7$ & $10$ & $8$ & $9$ hline end{tabular}
The median of the following data is $32.5$, find the missing frequencies $x$ and $y$ : Class: $0-10$ $10-20$ $20-30$ $30-40$ $40-50$ $50-60$ $60-70$ Total Frequency: $x$ $5$ $9$ $12$ $y$ $3$ $2$ $40$
Show SolutionHide Solution↓
Correct table (I) (1 Mark) Median Class $= 30 - 40$ (II) ($\frac{1}{2}$ Mark) $\therefore 32.5 = 30 + \frac{10}{12} (\frac{40}{2} - (x+14))$ (III) (1 Mark) $\Rightarrow x = 3$ (IV) ($\frac{1}{2}$ Mark) $x + y + 31 = 40$ $\Rightarrow 3 + y = 9$ (V) (1 Mark) $\therefore y = 9-3 = 6$ (VI) ($\frac{1}{2}$ Mark)
Weekly expenditure on Ayurvedic medicines of few households in a locality is recorded below. If the mean expenditure for this is ₹211, then find the value of the missing frequency 'y'.
Show SolutionHide Solution↓
Correct table Mean $= 211$ $225 + \frac{(-7)}{13+y} \times 50 =211$ $\Rightarrow y = 12$
One healthcare center working for the welfare of the patients suffering from 'Dengue', recorded the following information : Age of Patients quad Number of Patients $0-15$ quad $8$ $15-30$ quad $5$ $30-45$ quad $x$ $45-60$ quad $16$ $60-75$ quad $12$ $75-90$ quad $9$ If the modal age of the patients is $54$, then find the value of $x$.
Show SolutionHide Solution↓
Modal class is $45 - 60$ Mode = $54$ $\therefore 45 + \left(\frac{16-x}{2\times 16-x-12}\right) \times 15 = 54$ $\Rightarrow x = 10$
Weekly expenditure on Ayurvedic medicines of few households in a locality is recorded below. Weekly Expenditure (in ₹) quad Number of Households $100-150$ quad $4$ $150-200$ quad $5$ $200-250$ quad $y$ $250-300$ quad $2$ $300-350$ quad $2$ If the mean expenditure for this is ₹$211$, then find the value of the missing frequency 'y'.
Show SolutionHide Solution↓
Correct table Mean = $211$ $\Rightarrow 225 + \frac{(-7)}{13+y} \times 50 = 211$ $\Rightarrow y = 12$
The mode of the following frequency distribution is $55$. Find the missing frequencies 'a' and 'b'. Class Interval $0-15$ $15-30$ $30-45$ $45-60$ $60-75$ $75-90$ Total Frequency $6$ $7$ $a$ $15$ $10$ $b$ $51$
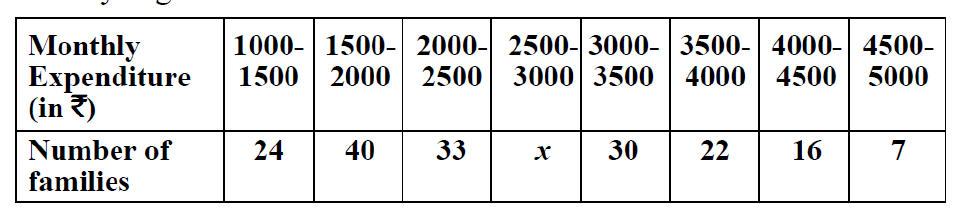
The monthly expenditure on milk in $200$ families of a Housing Society is given below : Monthly Expenditure (in ₹) $1000-1500$ $1500-2000$ $2000-2500$ $2500-3000$ $3000-3500$ $3500-4000$ $4000-4500$ $4500-5000$ Number of families $24$ $40$ $33$ $x$ $30$ $22$ $16$ $7$ Find the value of $x$ and also, find the median and mean expenditure on milk.
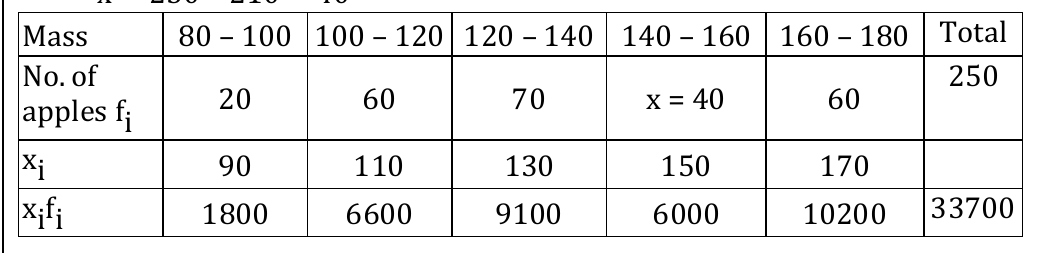
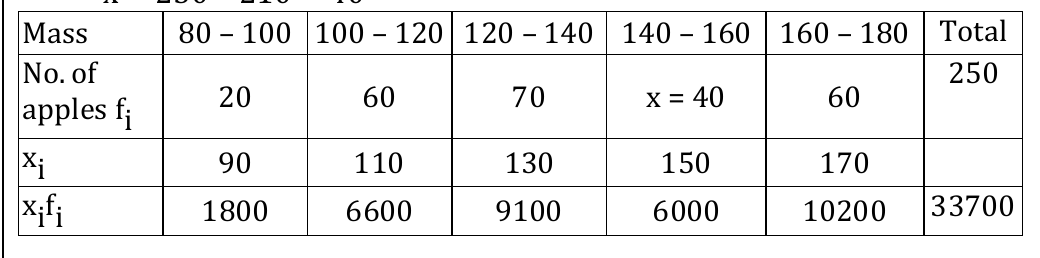
250 apples of a box were weighed and the distribution of masses of the apples is given in the following table : Mass (in grams) 80-100 100-120 120-140 140-160 160-180 Number of apples 20 60 70 x 60 (i) Find the value of $x$ and the mean mass of the apples. (ii) Find the modal mass of the apples.
Show SolutionHide Solution↓
(i) $20 + 60 +70 + x + 60 = 250$ $x = 250-210 = 40$ Mass 80-100 100-120 120-140 140-160 160-180 Total No. of apples $f_i$ 20 60 70 $x = 40$ 60 250 $x_i$ 90 110 130 150 170 $f_ix_i$ 1800 6600 9100 6000 10200 33700 Mean mass $= \frac{33700}{250} = 134.8$ Mean mass = $134.8$ g (ii) Modal class = 120-140 Mode $= 120+\frac{(70-60)}{(140-60-40)} \times 20$ $= 125$ Hence modal mass = $125$ gm
250 apples of a box were weighed and the distribution of masses of the apples is given in the following table : Mass (in grams) Number of apples (i) Find the value of $x$ and the mean mass of the apples. (ii) Find the modal mass of the apples
Show SolutionHide Solution↓
(i)$20 + 60 + 70 + x + 60 = 250$ $x = 250-210 = 40$ Mass No. of apples $f_i$ $x_i$ $x_if_i$ Mean mass = $\frac{33700}{250} = 134.8$ Mean mass = $134.8$ g (ii) Modal class = $120-140$ Mode = $120 + \frac{(70-60)}{(140-60-40)} \times 20$ = $125$ Hence modal mass = $125$ g
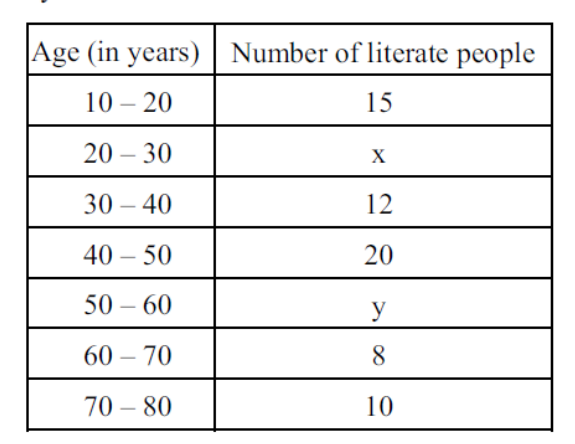
An age-wise list of number of literate people in a block is prepared in the following table. There are total $100$ people and their median age is $41.5$ years. Information about two groups are missing, which are denoted by $x$ and $y$. Find the value of $x$ and $y$. Age (in years) Number of literate people $10-20$ $15$ $20-30$ $x$ $30-40$ $12$ $40-50$ $20$ $50-60$ $y$ $60-70$ $8$ $70-80$ $10$
Show SolutionHide Solution↓
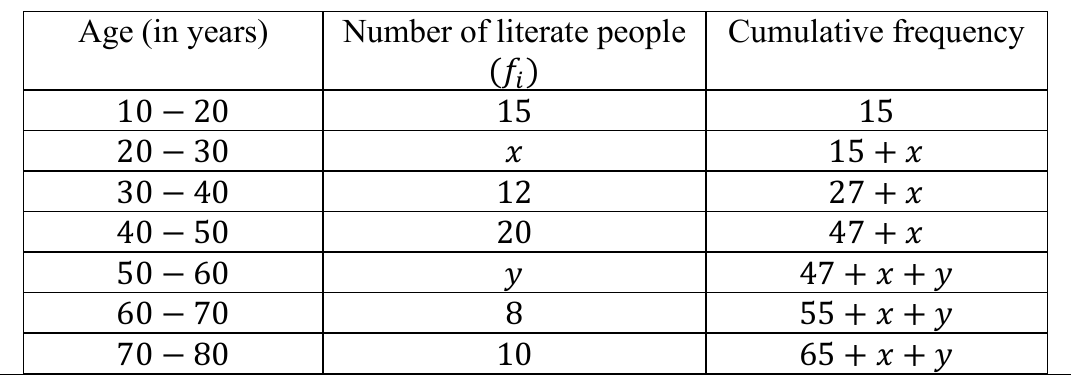
Age (in years) Number of literate people ($f_i$) Cumulative frequency $10-20$ $15$ $15$ $20-30$ $x$ $15 + x$ $30-40$ $12$ $27 + x$ $40-50$ $20$ $47 + x$ $50-60$ $y$ $47 + x + y$ $60-70$ $8$ $55 + x + y$ $70-80$ $10$ $65 + x + y$ $65 + x + y = 100$ $\Rightarrow x + y = 35$ ...(i) Median $= 41.5$ $40-50$ is the median class. $\Rightarrow 41.5 = 40 + \frac{\frac{100}{2}-27-x}{20} \times 10$ Solving, we get $x = 20$ From (i), $y = 15$
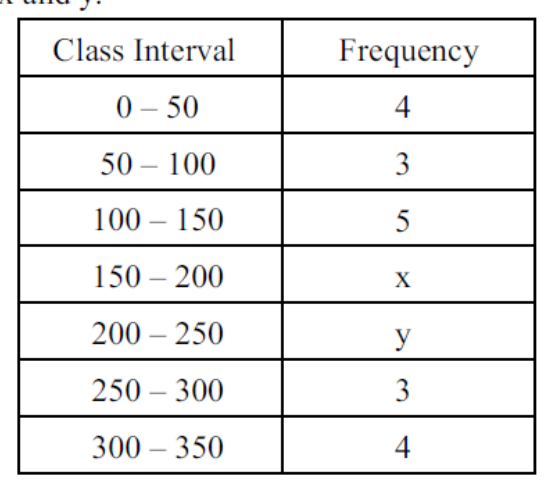
Mode of the following $30$ observations is $175$. Find the values of the missing frequencies x and y. Class Interval Frequency $0-50$ $4$ $50-100$ $3$ $100-150$ $5$ $150-200$ $x$ $200-250$ $y$ $250-300$ $3$ $300-350$ $4$
Show SolutionHide Solution↓
Here, modal class $= 150 - 200$ and $f_0 = 5, f_1 = x, f_2 = y$ and $h = 50$ Mode $= 175$ $150 + \frac{x-5}{2x-5-y} \times 50 = 175$ $\Rightarrow y = 5$ Also, $19 + x + y = 30$ $\Rightarrow x = 6$
In the following table, the median age of $200$ spectators of a football match is $32$. Find the missing frequencies $p$ and $q$. Age (in years) Number of Spectators $0-10$ $20$ $10-20$ $p$ $20-30$ $50$ $30-40$ $60$ $40-50$ $32$ $50-60$ $q$
Show SolutionHide Solution↓
Age (in years) Number of consumers Cumulative frequency $0-10$ $20$ $20$ $10-20$ $p$ $20 + p$ $20-30$ $50$ $70+ p$ $30-40$ $60$ $130 + P$ $40-50$ $32$ $162 + p$ $50-60$ $q$ $162 + p + q$ Total $162 + p + q$ $1$ mark for correct table $162 + p + q = 200$ $\Rightarrow p + q = 38$ (i) Median $= 32 \Rightarrow 30-40$ is the median class. $\Rightarrow 32 = 30 + \frac{(100-70-p)}{60} \times 10$ Solving, we get $p = 18$ From (i), $q = 20$
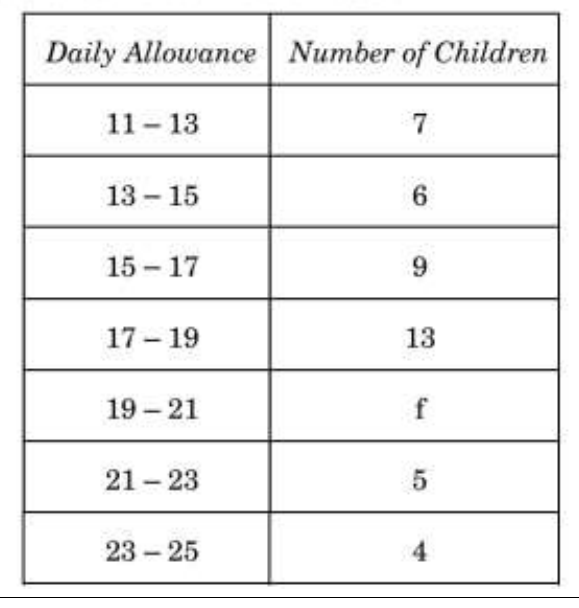
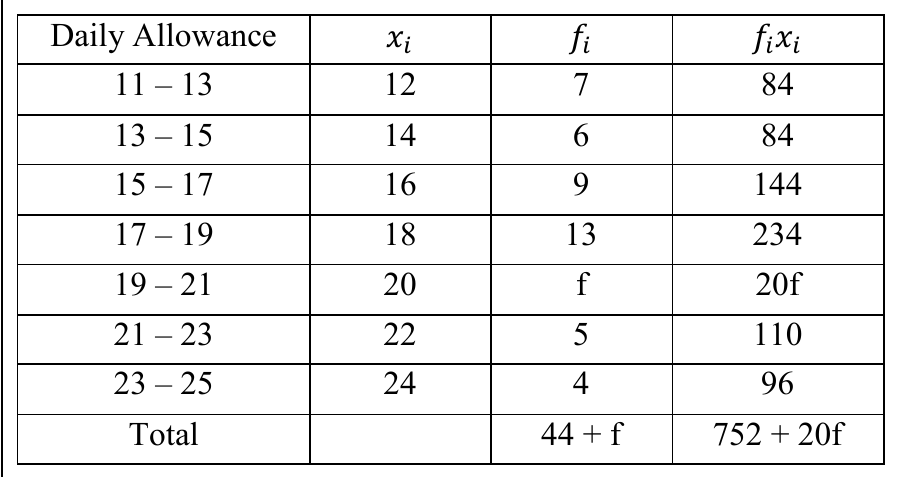
The following distribution shows the daily pocket allowance of children of a locality. The mean daily pocket allowance is ₹36.10. Find the missing frequency, $f$. Daily pocket allowance (in $\text{Rs}$) Number of children $20-25$ $7$ $25-30$ $6$ $30-35$ $9$ $35-40$ $13$ $40-45$ $f$ $45-50$ $5$ $50-55$ $4$
The median of the following distribution is $545$. If the sum of all frequencies is $100$, then find the values of $x$ and $y$. Class quad Frequency $0-100$ quad $3$ $100-200$ quad $4$ $200-300$ quad $5$ $300-400$ quad $x$ $400-500$ quad $17$ $500-600$ quad $20$ $600-700$ quad $19$ $700-800$ quad $y$ $800-900$ quad $8$ $900-1000$ quad $3$
Show SolutionHide Solution↓
Correct table Therefore, $79 + x + y = 100$ $\Rightarrow x + y = 21$ Median class is $500 - 600$. Median = $545$ $\therefore 500 + \frac{\frac{100}{2} - (29+x)}{20} \times 100 = 545$ $\Rightarrow x = 12$ and $y = 9$
The median of 80 observations given in the following table is 138. Find the values of 'a' and 'b'. Class Interval Frequency 65-85 5 85-105 a 105-125 13 125-145 20 145-165 b 165-185 10 185-205 7
Show SolutionHide Solution↓
Correct table $55 + a + b = 80$ $\Rightarrow a + b = 25$ Median class is 125 – 145 Median = 138 $\therefore 125 + \left(\frac{80}{2} - (18+a)\right) \times \frac{20}{20} = 138$ $\Rightarrow a = 9$ and $b = 16$
Find the values of the missing frequencies $p$ and $q$ in the following distribution of $100$ observations. The median of the distribution is given as $47$.
Show SolutionHide Solution↓
Correct table $\therefore 69 + p + q = 100 \Rightarrow p+q=31$ Median class is $45 - 50$ Median $= 47$ $\therefore 45 + \left(\frac{100/2 - (29+p)}{20}\right) \times 5 = 47$ $\Rightarrow p = 13$ and $q = 18$
The mean of the following frequency distribution is $62.8$. Determine the values of $f_1$ and $f_2$. Class: $0-20$ $20-40$ $40-60$ $60-80$ $80-100$ $100-120$ Total Frequency: $5$ $f_1$ $10$ $f_2$ $7$ $8$ $50$
Show SolutionHide Solution↓
Correct table Mean = $62.8$ $\frac{2060 + 30f_1 + 70f_2}{50} = 62.8$ $\Rightarrow 30f_1+70f_2 = 1080$ or $3f_1 + 7f_2 = 108$ --- (1) Also, $30 + f_1 + f_2 = 50$ $\Rightarrow f_1 + f_2 = 20$ --- (2) Solving (1) and (2), we get $f_1 = 8$ and $f_2 = 12$
The median of the following frequency distribution is $35$. Find the value of $x$ and hence find the mode. Class: $0-10$ $10-20$ $20-30$ $30-40$ $40-50$ $50-60$ $60-70$ Frequency: $2$ $3$ $x$ $6$ $5$ $3$ $2$
Show SolutionHide Solution↓
Correct table Median class is $30 – 40$ Median = $35$ $\therefore 30 + \frac{(\frac{21+x}{2})-(5+x)}{6} \times 10 = 35$ $\Rightarrow x = 5$ Modal class is $30 – 40$ Mode = $30+\frac{6-5}{2\times6-5-5} \times 10$ $= 35$
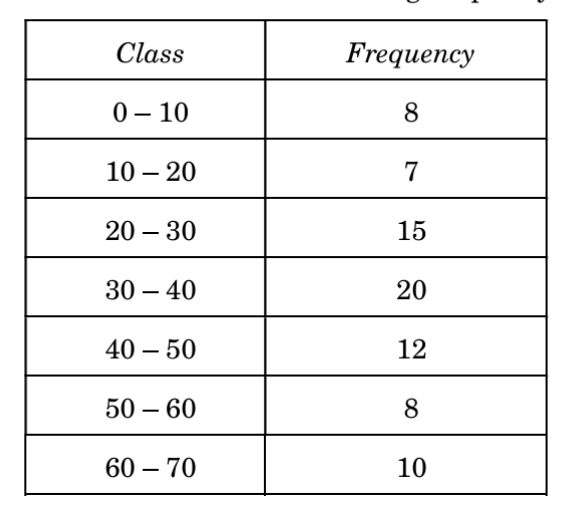
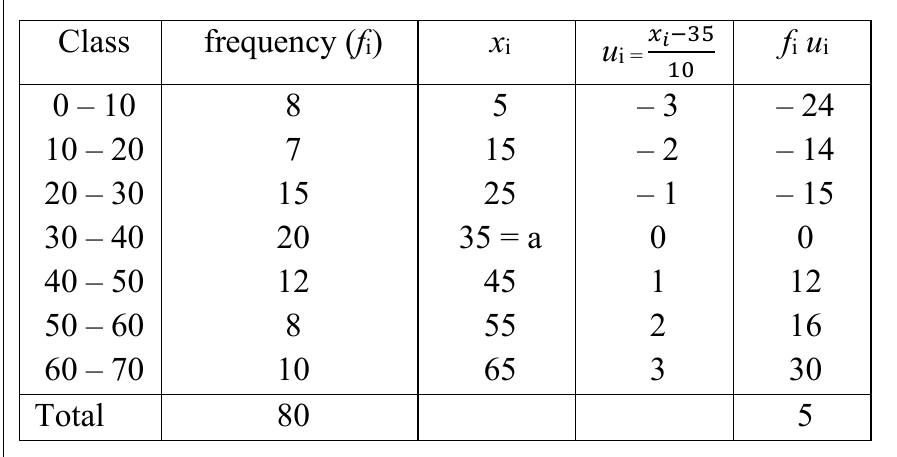
Following distribution shows the marks of 230 students in a particular subject. If the median marks are 46, then find the values of $x$ and $y$.
Show SolutionHide Solution↓
Correct table (1 mark). $150 + x + y = 230 \Rightarrow x + y = 80$ (1 mark). Median is 46 $\therefore$ Median class is 40 - 50 ($\frac{1}{2}$ mark). $46 = 40 + [\frac{230/2 - (42+x)}{65}] \times 10$ (1 mark). On solving, we get $x = 34$ and $y = 46$ (1 + $\frac{1}{2}$ marks).
The population of lions was noted in different regions across the world in the following table : If the median of the given data is $525$, find the values of $x$ and $y$.
Show SolutionHide Solution↓
Correct table $74 + x + y = 100 \implies x + y = 26$ Median class is $500 - 600$ $525 = 500 + [\frac{50 - (28+x)}{20}] \times 100$ On solving, we get $x = 17, y = 9$
The mean of the following frequency distribution is $35$. Find the values of $x$ and $y$, if the sum of frequencies is $25$ : Class $0-10$ $10-20$ $20-30$ $30-40$ $40-50$ $50-60$ $60-70$ Frequency $1$ $x$ $5$ $7$ $y$ $3$ $1$
Show SolutionHide Solution↓
Correct Table (2 Marks) $\sum f_i = 25 \implies x + y = 8$ ..... (i) (1/2 Mark) Mean $(\bar{x}) = \frac{605+15x+45y}{25} = 35$ (1/2 Mark) $\implies 15x + 45y = 270$ or $x + 3y = 18$ ..... (ii) (1 Mark) Solving (i) and (ii), we get $x = 3, y = 5$ (1/2 Mark + 1/2 Mark)
The median of the following data is $50$ and sum of all frequencies is $90$ : Class: $20-30$ $30-40$ $40-50$ $50-60$ $60-70$ $70-80$ $80-90$ Frequency: $p$ $15$ $25$ $20$ $q$ $8$ $10$ Find the values of $p$ and $q$.
If the median of the distribution given below is $28.5$, find the values of $x$ and $y$. Class: 0-10 10-20 20-30 30-40 40-50 50-60 Total Frequency: 5 $x$ 20 15 $y$ 5 60
Show SolutionHide Solution↓
Correct table (I) (1½ Mark) Median Class = $20-30$ (II) (1/2 Mark) $\therefore 28.5 = 20 + \frac{10}{20} (\frac{60}{2} - x - 5)$ (III) (1 Mark) $\Rightarrow x = 8$ (IV) (1/2 Mark) As, $x + y + 45 = 60$ (V) (1 Mark) $\Rightarrow 8 + y = 15$ $\therefore y = 7$ (VI) (1/2 Mark)
The mean of the following frequency distribution is 28. If sum of all frequencies is 100, then find the values of $p$ and $q$: Class Interval 0-10 10-20 20-30 30-40 40-50 50-60 Frequency 12 p 27 20 q 6
Show SolutionHide Solution↓
Class Interval $x_i$ $f_i$ $f_ix_i$ 0-10 5 12 60 10-20 15 p 15p 20-30 25 27 675 30-40 35 20 700 40-50 45 q 45q 50-60 55 6 330 Total 65+p+q 15p+45q+1765 Correct table (I) (2) $\sum f_i = 100 = 65 + p + q \Rightarrow p + q = 35$ (II) (1/2) Mean = $28 = \frac{15p + 45q + 1765}{100}$ (III) (1) $\Rightarrow p + 3q = 69$ (IV) (1/2) On solving, we get $p = 18, q = 17$ (V) (1/2+1/2)
OR If the median of the following frequency distribution is $32.5$ and sum of all frequencies is $40$, then find the values of $f_1$ and $f_2$: Class Interval: $0-10$ $10-20$ $20-30$ $30-40$ $40-50$ $50-60$ $60-70$ Frequency: $3$ $f_1$ $9$ $12$ $6$ $f_2$ $2$
Show SolutionHide Solution↓
Correct table (I Mark) Median = $32.5 \therefore$ Median class is $30 - 40$ (II Mark) $32.5 = 30 + \frac{20 - (12 + f_1)}{12} \times 10$ (III Mark) $\Rightarrow f_1 = 5$ (IV Mark) $\therefore 32 + f_1 + f_2 = 40$ $\therefore f_2 = 3$ (V Mark)
The mean of the following distribution is $53$. Find the missing frequency $p$. Class Interval: $0-20 \quad 20-40 \quad 40-60 \quad 60-80 \quad 80-100$ Frequency: $12 \quad 15 \quad p \quad 28 \quad 13$ Hence, find mode of the distribution.
Show SolutionHide Solution↓
Correct table (2 Marks) Mean = $53 = \frac{3700 + 50p}{68 + p}$ (1/2 Mark) $\Rightarrow p = 32$ (1/2 Mark) Modal class is $40 - 60$ (1/2 Mark) Mode = $40 + \frac{32-15}{64-15-28} \times 20$ (1 Mark) = $\frac{1180}{21}$ or $56.1$ (approx.) (1/2 Mark)
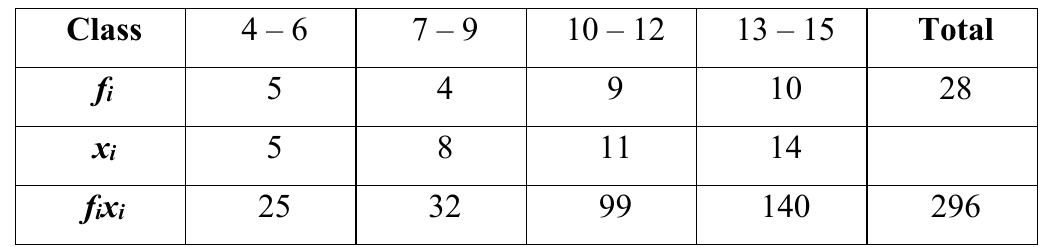
Find the missing frequencies $p$ and $q$ in the following frequency distribution, when sum of frequencies is $40$ and mean is $19$: Class: $0-5, 5-10, 10-15, 15-20, 20-25, 25-30, 30-35$ Frequency: $2, 5, 6, p, 10, q, 4$
This section has 20 Multiple Choice Questions (MCQs) carrying 1 mark each. What is the mode of a data if median and mean of the same data are $9-6$ and $10-5$, respectively?
Assertion (A): If the Mode and Mean of a data are $12 k$ and $15 k$, then Median of the data is $14 k$. Reason (R) : The relation between the Mean, Mode and Median of a data is: Mean = $3$ Median $- 2$ Mode.
Show SolutionHide Solution↓
(C) Assertion (A) is true, but Reason (R) is false.
Assertion (A) : If the difference of the mode and median of a data is $24$, then the difference of the median and mean is $12$. Reason (R) : $\text{Mode} = 3 \text{ mean} - 2 \text{ median}$.
(a)Both Assertion (A) and Reason (R) are true and Reason (R) is the correct explanation of the Assertion (A).
(b)Both Assertion (A) and Reason (R) are true, but Reason (R) is not the correct explanation of Assertion (A).
(c)Assertion (A) is true, but Reason (R) is false.
(d)Assertion (A) is false, but Reason (R) is true.
Show SolutionHide Solution↓
(C) Assertion (A) is true, but Reason (R) is false.
Assertion (A): If the value of mode and mean for a distribution is $50$ and $56$ respectively, then the value of median is $54$. Reason (R) : Median = $\frac{1}{3}$ (Mode - $2$ Mean)
Show SolutionHide Solution↓
(C) Assertion (A) is true, but Reason (R) is false.
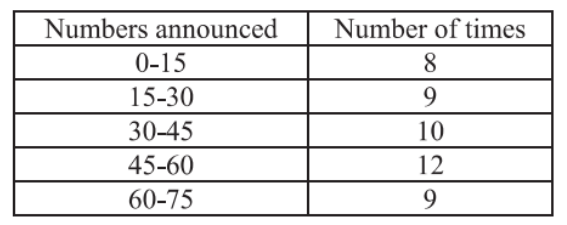
BINGO is game of chance. The host has $75$ balls numbered $1$ through $75$. Each player has a BINGO card with some numbers written on it. The participant cancels the number on the card when called out a number written on the ball selected at random. Whosoever cancels all the numbers on his/her card, says BINGO and wins the game. The table given below, shows the data of one such game where $48$ balls were used before Tara said 'BINGO'.
Numbers announced
Number of times
0-15
8
15-30
9
30-45
10
45-60
12
60-75
9
Based on the above information, answer the following : (i) Write the median class. (ii) When first ball was picked up, what was the probability of calling out an even number? (iii) (a) Find median of the given data. OR (b) Find mode of the given data.
Show SolutionHide Solution↓
Number announced | 0-15 | 15-30 | 30-45 | 45-60 | 60-75 Number of times (f) | 8 | 9 | 10 | 12 | 9 cf | 8 | 17 | 27 | 39 | 48=N (i) $\frac{N}{2} = 24$ $\therefore$ median class is $30 - 45$ (ii) P (picking up an even number) = $\frac{37}{75}$ (iii) (a) Median = $30 + \frac{\left(\frac{48}{2} - 17\right)}{10} \times 15$ $= 40.5$ OR (iii) (b) Modal class is $45 - 60$ Mode = $45 + \frac{12-10}{2\times 12-10-9} \times 15$ $= 51$
The denominator of a fraction is $2$ more than the numerator. If $2$ is added to both its numerator and denominator, then the sum of the new fraction and the original fraction is $\frac{46}{35}$. Find the original fraction.
Show SolutionHide Solution↓
Let the fraction be $\frac{x}{x+2}$ Therefore, $\frac{x}{x+2} + \frac{x+2}{x+4} = \frac{46}{35}$ $\Rightarrow 24x^2 + 4x - 228 = 0$ or $6x^2 + x - 57 = 0$ $\Rightarrow (6x + 19)(x - 3) = 0$ $x \neq -\frac{19}{6}$ $\therefore x = 3$ So, the required fraction is $\frac{3}{5}$